What to put in a monthly client social media report
A one-page monthly report for social media clients: the goal, three to five numbers against last month, top and weakest posts, what changes next, and how to share it as a link from eksis.
5 min read



On this page
You manage a client's social accounts, and once a month they want to know what they paid for. A good monthly report fits on one page: what you published, what happened, what you learned, and what changes next month. Here is what to put in it, how to explain the numbers honestly, and what to leave out.
The short answer
- Lead with the client's goal, then show the two or three numbers that measure it, each compared with last month.
- Include: posts published, reach, engagement rate (with how you calculated it), follower change, the top posts, what you changed, next month's plan, and questions for the client.
- Leave out: metrics nobody acts on, screenshots of every post, and numbers you cannot explain.
- Send it on the same day each month, a few days after the month closes, so late numbers have settled.
- In eksis: on Super Eksis, Share report in Analytics creates a read-only link for the period and channels you are viewing, which the client can open without an account and save as a PDF.
What goes in a one-page report
1. The goal and the headline
Start with one sentence that ties the month to what the client wants: more enquiries, more store visits, a bigger audience on one platform. Then the headline result in plain words, for example "Reach on Instagram was up on last month; enquiries by DM were flat."
2. Three to five numbers, each with last month next to it
| Number | What it tells the client |
|---|---|
| Posts published, per platform | Whether the plan was delivered |
| Reach | How many accounts saw the posts |
| Engagement rate | How many of those people reacted |
| Follower change | Net growth over the month |
| Clicks or enquiries, if you track them | Whether social sent anyone to the business |
Write down how you calculate engagement rate and keep it the same every month. Engagement divided by reach and engagement divided by followers give different numbers, and switching between them makes a month look better or worse than it was. Our guide to what counts as a good engagement rate explains the common formulas. If the client wants clicks, tag links with UTM parameters so the visits show up in their analytics; see UTM links for social media.
3. Top posts, and the weakest
Show the two or three posts that did best on the metric that matters, with one line on why you think they worked. Then name the post that did worst and what you take from it. Leaving the misses out makes the report less useful and makes next month's changes hard to explain.
4. What changed and what comes next
List what you changed this month (a new format, a new posting time, a new series) and what you will change next month, each tied to something in the numbers. One or two changes are easier to judge than five.
5. Questions for the client
Ask for what you need: product news for next month, approvals, access, feedback on a campaign. The report is also the agenda for your next call.
Explain numbers honestly
- Compare like with like. Same metric, same calculation, same channels, month against month.
- Say what you cannot see. Some networks do not report every number to outside tools, so say when a figure is missing rather than leaving a blank that looks like zero.
- Small accounts swing. One post that travels can double a month's reach. Say so instead of promising it again.
- Do not claim causes you cannot show. "Reach rose after we moved posts to the evening" is a pattern to test, not proof.
Our guide to the social media metrics worth tracking covers which numbers deserve a place, and the monthly review habit covers the look back you do before writing the report.
What to leave out
Vanity totals nobody acts on, every post's screenshot, long lists of platform news, and jargon. If the client would not change a decision because of a number, it does not need to be on the page.
Build and share the report in eksis
eksis Analytics shows reach, engagement, engagement rate, followers, and a post-by-post table for the channels and period you pick, compared with the previous period.
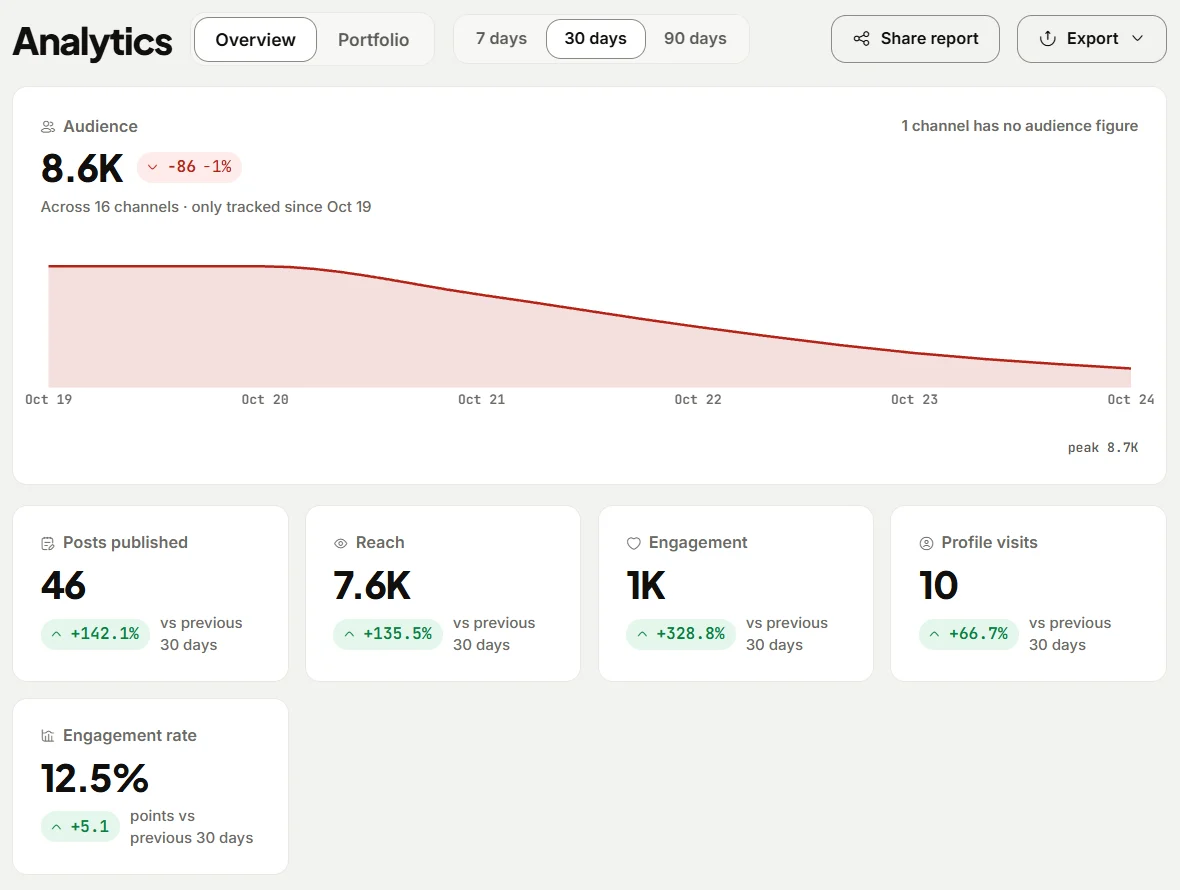
On Super Eksis, choose Share report in Analytics. eksis creates a link to the current view: the period and channels you selected. Anyone with the link can see that report without an eksis account until the date shown in the dialog. Choose Copy link and send it to the client. The report page has Save as PDF if the client wants a file for their records. Some networks do not share every number with outside apps; the report says when a figure is not reported instead of showing zero.
Super Eksis is billed per workspace, so you can keep each client in its own workspace with its own channels and its own report link.
Plans and limits
Analytics is included on every paid plan; the Free plan does not include it. Client reports with Share report are part of Super Eksis, which is $2 per workspace a month with a minimum of 5 workspaces. Pro Eksis is $3 a month for one workspace with up to 20 accounts and full analytics, without the client report link. See compare plans.
Sources
- eksis docs: Analytics (read November 11, 2026)
- eksis docs: Plans (read November 11, 2026)
Frequently Asked Questions
What should a monthly social media report include?
The client's goal, three to five numbers compared with last month (posts published, reach, engagement rate, follower change, and clicks or enquiries if tracked), the top and weakest posts, what you changed, next month's plan, and questions for the client.
How long should a client social media report be?
One page is enough for most small clients. If you need more, put the detail in an appendix and keep the first page to the result, the numbers, and the plan.
Should I include posts that did badly?
Yes. Name the weakest post and what you learned from it. Clients trust a report more when it explains misses as well as wins.
Can I send the client a link instead of a PDF?
In eksis, yes, on Super Eksis: Share report creates a read-only link the client can open without an account until the date shown, and the report page can be saved as a PDF.