What counts as a good engagement rate on Instagram and Facebook in 2026
Buffer puts the typical Instagram engagement rate at about 5.5% and Socialinsider at 0.48%, and both are right for the formula they use. Here is how engagement rate is calculated, what four benchmark studies found, and how to judge your own.
10 min read



On this page
The typical engagement rate on Instagram is anywhere from about 0.5% to 5.5%, and on Facebook from 0.15% to 5.6%, depending on whose benchmark you read. That range is not a typo. Socialinsider divides interactions by followers and gets an Instagram average of 0.48% for 2025. Buffer divides interactions by reach and gets a median of about 5.5%. Both are large, named studies, and both are right for the formula they use.
So before asking whether your number is good, find out which formula produced it. This guide explains the common formulas, what Instagram and Meta count as engagement, what four benchmark studies found with their sample sizes as they read on October 24, 2026, and how to compare your own account fairly.
The short answer
- If you divide by reach (people who saw the post), Buffer's 2025 medians are about 5.5% on Instagram and 5.6% on Facebook.
- If you divide by followers, Socialinsider's 2025 averages are 0.48% on Instagram and 0.15% on Facebook.
- Hootsuite calls 1% to 5% a good engagement rate in general, and lists 4.2% for Instagram carousels and 2.9% for Facebook albums as its all-industry figures.
- Compare your rate only against a benchmark built with the same formula, on the same network, ideally in your industry.
- The most useful comparison is your own account over time. Pick one formula and keep it.
How engagement rate is calculated
Every formula puts interactions on top. They differ in what goes underneath.
| Formula | Calculation | Typical use |
|---|---|---|
| By reach | Interactions ÷ reach × 100 | How people who saw a post responded |
| By followers | Interactions ÷ followers × 100 | Comparing posts or accounts when reach is not available, for example a competitor's |
| By impressions or views | Interactions ÷ impressions (or views) × 100 | Paid posts and video |
| Daily | Interactions in a day ÷ followers × 100 | Overall account activity, including old posts |
Hootsuite, which lists six variants including cost per engagement, calls the reach formula the most common. Reach counts unique accounts, so a post seen three times by one person counts once. Impressions and views count every display, which makes rates based on them lower.
A follower-based rate falls as an account grows. Hootsuite says to expect it, and Socialinsider limits its sample to brands with 1,000 to 1 million followers, saying the smallest and largest accounts produce outliers.
What counts as engagement on Instagram and Facebook
The top half of the formula is not fixed either.
On Instagram, the app's insights define Interactions as "the number of actions people take when they engage with your content, such as likes, comments, saves and shares." The same help page defines Viewers as unique accounts that saw your content (what most tools call reach) and Views as the number of times it was played or displayed. Instagram does not show an engagement rate, so you calculate it: Interactions ÷ Viewers × 100 for each post.
On Facebook, Meta's own Post engagement metric for ads is much broader. Meta lists actions that may count toward it, including shares, reactions, saves, comments, 3-second video plays, photo views, link clicks, profile clicks, and follows. A rate built on that number is not comparable with one built on reactions, comments, and shares.
The studies below each chose their own set:
| Study | Instagram interactions | Facebook interactions |
|---|---|---|
| Buffer | Likes, comments, shares (its format analysis also includes saves) | Reactions, comments, shares |
| Socialinsider | Likes and comments | Reactions, comments, shares |
| Rival IQ | Likes, comments, shares, reactions | Likes, comments, shares, reactions |
| Hootsuite | Likes, comments, shares, saves, Story replies | Reactions, comments, shares, link and button clicks |
What the benchmark studies found
Buffer: by reach, Buffer users' posts
Buffer's 2026 State of Social Media Engagement report draws on more than 52 million posts published through Buffer, with cross-platform baselines from 2025 data and a 2024 comparison. Accounts had to post at least 10 times a year across at least 4 different weeks. It reports medians and defines engagement rate as engagements divided by reach.
- Instagram: about 5.5% in 2025, down from about 7.3% in 2024.
- Facebook: about 5.6% in 2025, up from about 5.0% in 2024.
Buffer warns that its user base changed between the two years and can move medians as much as the platforms do. The report also gives Instagram as 5.46% and 5.4% in different places, so read it as roughly 5.5%.
Socialinsider: by followers, brand accounts
Socialinsider's 2026 benchmarks analyze organic posts from brand accounts with 1,000 to 1 million followers, from January 2024. The page says its 2026 figures are 2025 values. Engagement rate is interactions divided by followers.
- Instagram: 0.48% in 2025, down from 0.50%. Its quarterly update gives 0.45% for the third quarter of 2026.
- Facebook: 0.15% in both 2024 and 2025, and 0.13% in the third quarter of 2026.
The sample sizes are large but stated inconsistently. The overview says 70 million posts across four networks, while its methodology lists 75.6 million Instagram posts and 71.9 million Facebook posts. Its Instagram page says 35 million posts in the introduction and 67.5 million in the methodology.
Rival IQ: by followers, 150 companies per industry
Rival IQ's 2025 Social Media Industry Benchmark Report analyzed more than 4 million posts across Facebook, Instagram, TikTok, and X, selecting 150 companies at random in each of 14 industries from a database of over 200,000. Facebook fan counts had to sit between 25,000 and 1 million. It uses medians, divides interactions by followers, and includes both organic and paid posts. The rates themselves are published as charts. The text reports that engagement rates fell year over year, by 36% on Facebook and 16% on Instagram, and that Health & Beauty brands had the lowest engagement of the 14 industries.
Hootsuite: by content type and industry
Hootsuite's 2026 engagement rate guide says a good rate generally falls between 1% and 5%. Its all-industry figures are given for each network's best-performing content type: 4.2% for Instagram carousels and 2.9% for Facebook albums. The guide does not state a sample size for these figures. By industry it lists, for example:
| Industry | ||
|---|---|---|
| Consumer goods and retail | 3.6% | 1.9% |
| Dining, hospitality, and tourism | 3.7% | 2.4% |
| Finance | 4.1% | 2.4% |
| Healthcare, pharma, and biotech | 4.5% | 3.8% |
| Nonprofit | 5.5% | 3.0% |
Hootsuite calls a 12% Instagram rate "exceptionally high" and 0.5% below average on most networks. Measured by followers, Socialinsider's Instagram average is 0.48%, so the same 0.5% is about typical. That is the formula problem in one number.
Why the benchmarks disagree
- The denominator. Reach is usually far smaller than follower count, so reach-based rates come out many times higher. That alone explains most of the gap between Buffer and Socialinsider.
- The numerator. Socialinsider counts only likes and comments on Instagram. Buffer and Hootsuite add shares, and Hootsuite adds saves. More actions, higher rate.
- Median or average. Buffer and Rival IQ report medians, Socialinsider reports averages. A few viral posts lift an average but not a median.
- Who is in the sample. Buffer's sample is its customers, Socialinsider's is brands between 1,000 and 1 million followers, Rival IQ's is mid-size and large companies, and Rival IQ includes paid posts.
- The direction disagrees too. Buffer has Facebook rising from 2024 to 2025, Socialinsider has it flat, and Rival IQ has it falling 36%. All three see Instagram falling.
How to judge your own engagement rate
- Pick one formula and write it down. For your own posts, use reach, since Instagram and Meta give you that number.
- Use the same interactions every time. If you add saves this month, add them every month, or your trend measures your method.
- Calculate it per post, then take the median of the month, so one viral post does not set your baseline.
- Compare against a benchmark with the same formula: Buffer for reach-based rates, Socialinsider or Rival IQ for follower-based ones, and Hootsuite's industry table for a rough industry check.
- Compare formats separately. Hootsuite's top Instagram figure is for carousels, and Buffer and Socialinsider both found carousels ahead of Reels on engagement rate, so a Reel should be compared with your other Reels.
- Watch the trend over three months. A rate rising against your own past is more useful than any external benchmark.
Track engagement rate in eksis
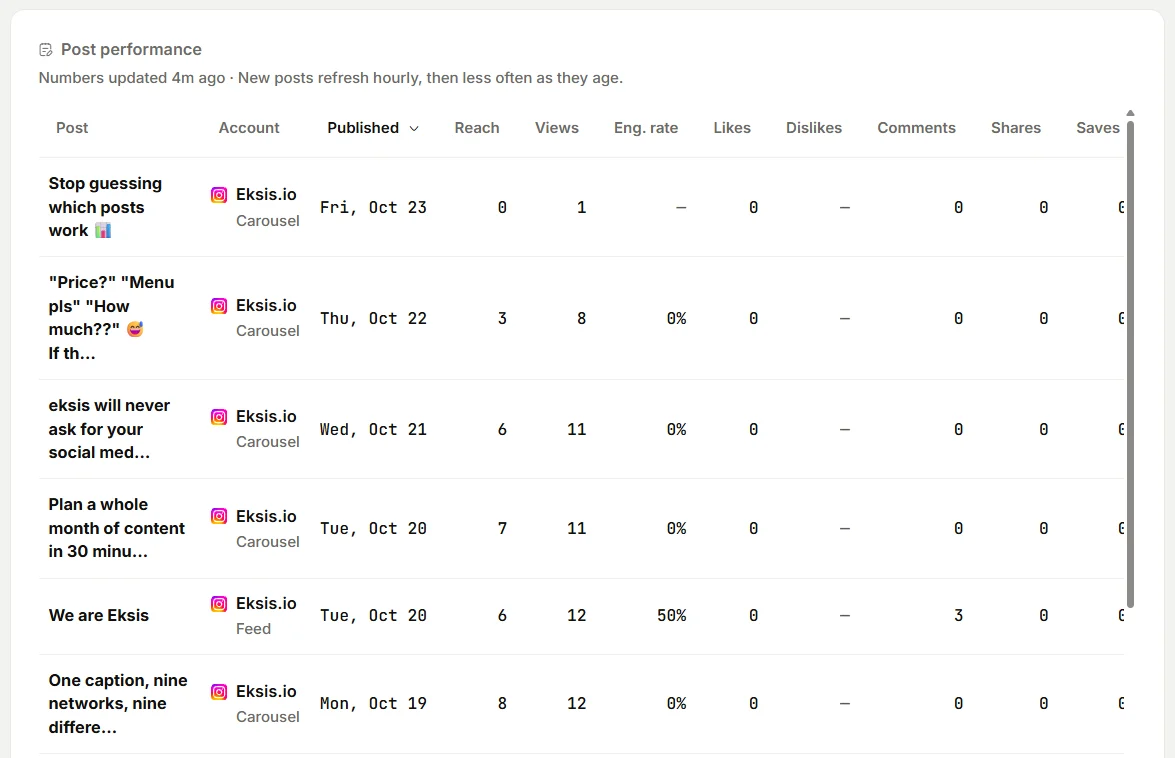
eksis Analytics (included from the Starter plan) calculates engagement rate by reach. Open Analytics, or Insights under one account, and the Post performance table shows each post's Reach, Eng. rate, likes, comments, shares, and saves. Engagement is likes, comments, shares, and saves added together, and Eng. rate divides it by reach.
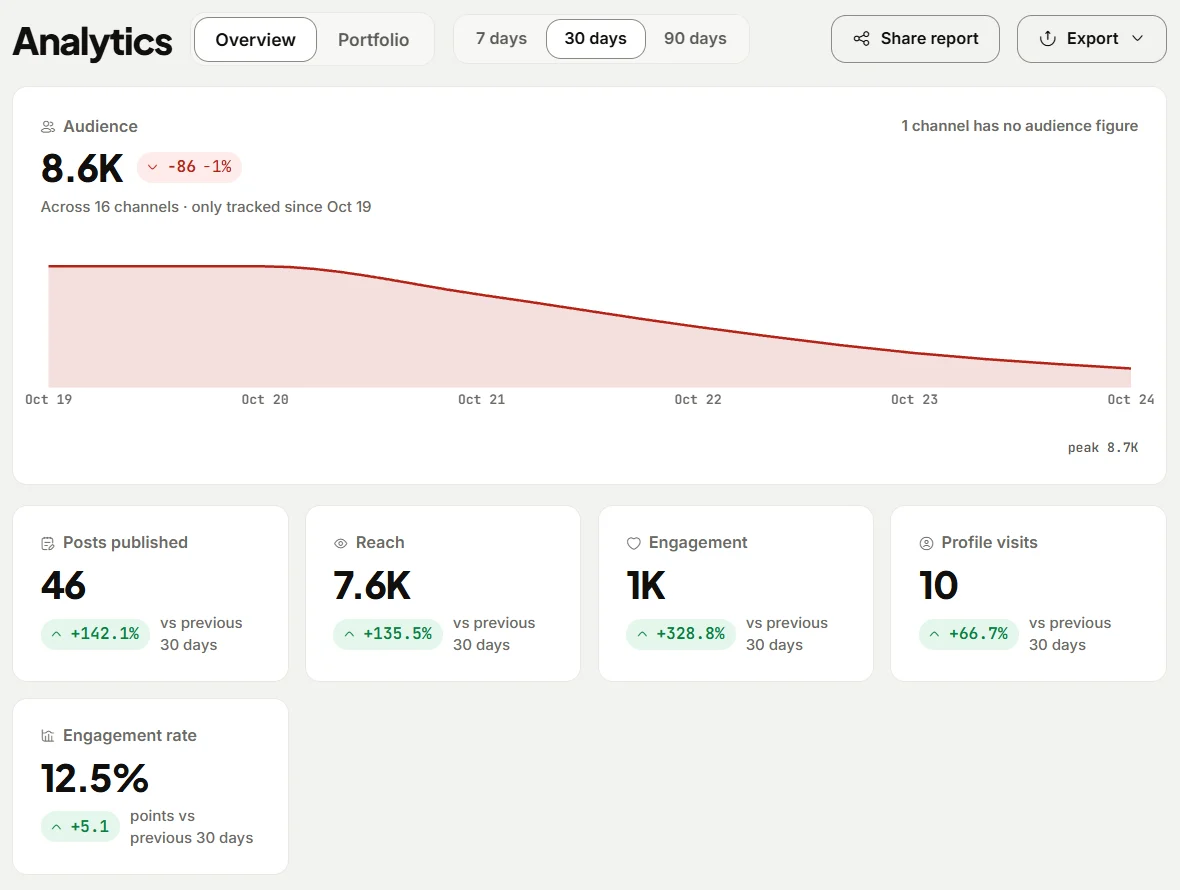
On Instagram, Reach is Instagram's count of unique accounts, and a separate Views column shows plays, which can count the same person more than once. Choose 7, 30, or 90 days at the top, and each summary number is compared with the previous period of the same length.
Facebook works differently. eksis receives views, reactions, comments, and shares for Page posts, but no reach figure, so the Eng. rate column stays empty for Facebook and the period's overall engagement rate leaves Facebook out. For a Facebook rate, use the reach Meta shows you, or compare follower-based rates using your Page's follower count.
Other details that affect the numbers:
- Posts you published directly in Instagram or Facebook count too, starting with up to 100 posts from the last 180 days.
- Numbers usually arrive within an hour of publishing, and eksis stops updating a post 30 days after it goes out.
- Export, then Posts, downloads the table as a CSV with an engagement and an engagement rate column, so you can take the median per month or per format.
The Free plan does not include Analytics. See the Instagram integration, the Facebook integration, or compare plans.
Related reading
- The social media metrics worth tracking, and the ones to ignore
- The best time to post on Instagram in 2026
- The best time to post on Facebook in 2026
Sources
- Buffer: The State of Social Media Engagement in 2026
- Socialinsider: 2026 social media benchmarks
- Socialinsider: 2026 Instagram organic benchmarks
- Rival IQ: 2025 Social Media Industry Benchmark Report
- Hootsuite: How to calculate engagement rate in 2026
- Instagram Help Center: About Instagram insights
- Meta Business Help Center: Post engagement in Meta ads
All were read on October 24, 2026. The companies update these studies, so check the source before you quote a number.
Frequently Asked Questions
What is a good engagement rate on Instagram?
It depends on the formula. By reach, Buffer's 2025 median is about 5.5%. By followers, Socialinsider's 2025 average for brand accounts is 0.48%. Hootsuite's all-industry figure for Instagram carousels is 4.2%, and it calls 1% to 5% good in general.
What is a good engagement rate on Facebook?
By reach, Buffer's 2025 median is about 5.6%. By followers, Socialinsider's average for brand Pages is 0.15%. Hootsuite gives 2.9% for Facebook albums across all industries, with industry figures from 1.9% (consumer goods and retail) to 3.8% (healthcare).
Should I calculate engagement rate by reach or by followers?
Use reach for your own posts, because it measures how people who actually saw a post responded and Instagram reports it. Use followers when reach is not available, for example when comparing with competitors, whose reach you cannot see.
Why is my Instagram engagement rate falling?
Several studies saw a drop. Buffer's median fell from about 7.3% in 2024 to about 5.5% in 2025, and Rival IQ reports a 16% fall. Buffer notes Instagram increasingly treats views as its main measure, so the traditional formula may capture less of what Instagram optimizes for. Compare your rate with your own past months before deciding it is a problem.
Does eksis calculate engagement rate?
Yes, on plans with Analytics. eksis divides likes, comments, shares, and saves by reach for each post. Instagram posts get a rate. Facebook posts do not, because eksis does not receive a reach figure for them, so their column stays empty.