Which post format gets the most reach on each platform in 2026, and what the studies actually measured
Most format studies measure engagement rate, not reach, and on Instagram the two point different ways. Here is what Buffer, Socialinsider, Rival IQ, and Hootsuite found for eight networks, and where they conflict.
10 min read



On this page
Most studies that rank post formats measure engagement rate, not reach. That matters, because the format that earns the most likes per viewer is often not the one that reaches the most people. Instagram is the clearest case: Buffer's data says Reels reach more people while carousels earn more engagement, and Socialinsider's data says carousels win on views as well.
This article goes network by network through the named studies that compare formats, as they read on October 24, 2026: Buffer's 2026 State of Social Media Engagement report (more than 52 million posts), Socialinsider's 2026 benchmarks, Rival IQ's 2025 industry report, and Hootsuite's 2026 benchmarks. Where they disagree, both answers are shown.
The short answer
| Network | What the studies favor | Where they conflict |
|---|---|---|
| Carousels for engagement | Reach: Buffer says Reels, Socialinsider says carousels | |
| Photos, by a small margin | Hootsuite names albums. Buffer finds all formats within one point | |
| Document carousels (Buffer) | Hootsuite names video | |
| X | Text posts | Rival IQ finds photo or video posts lead in several industries |
| TikTok | Video | No conflict in the studies read |
| Threads | Video, then images | Only one study |
| Video Pins (Buffer) | A Sprout Social survey says people prefer static images | |
| Bluesky | Video, by one interaction | Only one study |
- These studies compare reach by format for only one network, Instagram, and the two that do disagree.
- Link posts come last or near last everywhere Buffer measured them.
- Treat every row as a test to run on your own account, not a rule.
Why reach and engagement rate point in different directions
Engagement rate divides interactions by the number of people who saw a post. A format that is shown to many strangers, such as a Reel in Instagram's Reels tab, can have a large reach and a low rate at the same time, because most of those strangers watch and scroll on. Buffer says this directly: Reels are built for views and reach, which dilutes their engagement rate.
So decide what you want from a post first. If the goal is new people, compare reach. If the goal is a response from people who already follow you, compare engagement rate. The studies below mostly answer the second question.
Three studies compare Instagram formats, and they agree on engagement and disagree on reach.
| Study | Measure | Carousels | Reels | Single images |
|---|---|---|---|---|
| Buffer, 2025 data | Median engagement rate by reach | 6.90% | 3.31% | 4.44% |
| Socialinsider, 2025 data | Average engagement rate by followers | 0.55% | 0.52% | 0.37% |
| Hootsuite, 2026 | Best-performing type, all industries | 4.2% | Not stated | Not stated |
Rival IQ's 2025 report also says carousels outperformed Reels on engagement, though in some industries, Fashion and Home Decor among them, Reels led.
On reach, the two sources split:
- Buffer says Reels get the most reach, citing a separate analysis of more than 4 million Instagram posts published through Buffer between January 2022 and October 2024. It credits the dedicated Reels tab, which shows Reels to people who do not follow you.
- Socialinsider's 2026 Instagram benchmarks, built on brand accounts with 1,000 to 1 million followers, found carousels get the most views at every account size. For accounts with 1,000 to 5,000 followers, carousels averaged 993 views against 580 for Reels and 417 for images. Socialinsider credits Instagram showing an unengaged carousel a second time with a different slide.
The two are not measuring the same thing. Buffer uses reach (unique accounts), Socialinsider uses views as Instagram reports them, and Buffer's reach data is older. Buffer's report also describes the carousel advantage two ways: its summary says carousels earn 12% more engagement than Reels, while its format table shows a much wider gap. If reach matters most, test Reels and carousels side by side on your own account.
On Facebook, format matters less than anywhere else in these studies.
- Buffer: images 5.20%, video 4.84%, text 4.76%, links 4.43% (median engagement rate). Less than one percentage point separates images from text.
- Rival IQ: photos had the highest engagement for most of the industries it profiles, including Alcohol, Fashion, Financial Services, Food & Beverage, Health & Beauty, and Home Decor.
- Hootsuite: albums are its best-performing Facebook type, at 2.9% across all industries.
The studies agree that visuals edge out text and links. With gaps this small, what the post says will matter more than its format.
Here the studies conflict outright.
- Buffer: carousels, meaning document or PDF posts, earned a median engagement rate of 21.77%, about three times video (7.35%) and images (6.52%). Link posts (3.81%) and text posts (3.18%) came last.
- Hootsuite: video is LinkedIn's best-performing type, at 3.9% across all industries.
- Sprout Social cites its 2026 content strategy survey, in which text posts were the type LinkedIn users preferred (51%). That is a survey of preferences, not a measure of performance.
Buffer adds that carousel results vary widely: strong carousels topped 41%, weak ones sat around 5.4%, close to typical video and image posts.
X
- Buffer's engagement report: text posts 3.56%, images 3.40%, video 2.96%, links 2.25%.
- Buffer's X Premium analysis of 18.8 million posts: text led for Premium accounts (close to 0.9% by mid-2025), video came second, and links were weakest. For regular accounts, link posts had a median engagement rate of 0% from March 2025.
- Hootsuite: status updates (text posts) are X's best-performing type at 1.8%.
- Rival IQ: by industry the answer moves. Video posts led for Alcohol and Fashion brands, photo posts for Financial Services, Food & Beverage, and Home Decor.
Text-first holds across Buffer and Hootsuite. Leave links out unless the click is the whole point.
TikTok
- Buffer: video 3.39%, images 1.92%. Buffer notes that photo posts are more viable than you might expect on a video-first network.
- Hootsuite: videos are its best-performing TikTok type, at 1.5%.
Threads
- Buffer: video 5.55%, images 4.55%, text 2.79%, links 2.34%. Buffer adds that the formats overlap enough for any type to do well, and that a good text post can beat a mediocre video.
No other study read here breaks Threads down by format.
- Buffer: video Pins 5.75%, image Pins 3.15%, one of the largest format gaps in its data.
- Sprout Social cites its 2026 content strategy survey, in which consumers said they were most likely to interact with static images (38%) and Shoppable Pins (34%) on Pinterest.
The two are different kinds of evidence, one measured and one reported by consumers. Test video Pins if you can make them.
Bluesky and YouTube
- Bluesky: Buffer measures interactions, since Bluesky reports no reach. Video posts earned a median of 5 interactions, images 4, and text and links 3 each. A one-interaction gap is small.
- YouTube: none of these studies compares YouTube formats. Buffer reports only that the median YouTube video published through Buffer earned 433 views, and that views, not likes or comments, are the first gate on YouTube.
Why the studies disagree
- The measure. Buffer divides by reach, Socialinsider and Rival IQ divide by followers, and Hootsuite does not explain how it scored its best-performing types. A format can win on one and lose on another.
- The sample. Each study uses its own customers or tracked brands. Rival IQ picks 150 companies per industry and includes paid posts. Socialinsider tracks brands with 1,000 to 1 million followers.
- The period. Buffer's Instagram reach analysis runs to October 2024, while its format medians are from 2025. Socialinsider notes that Instagram changed how it reports views in 2025.
- Median or average. Buffer and Rival IQ use medians, Socialinsider uses averages, which a few viral posts can lift.
Test formats on your own account
- Pick two formats for one network, for example a Reel and a carousel on Instagram.
- Use the same topic for both, or alternate topics evenly, so the subject does not decide the result.
- Post each format at least six times over a month, at similar hours.
- Decide your measure before you look: reach if you want new people, engagement rate if you want a response.
- Compare medians per format, not totals, and keep the winner for a month before testing the next pair.
Compare formats in eksis
eksis does not chart formats against each other for you, but it gives you what you need to do it in a few minutes.
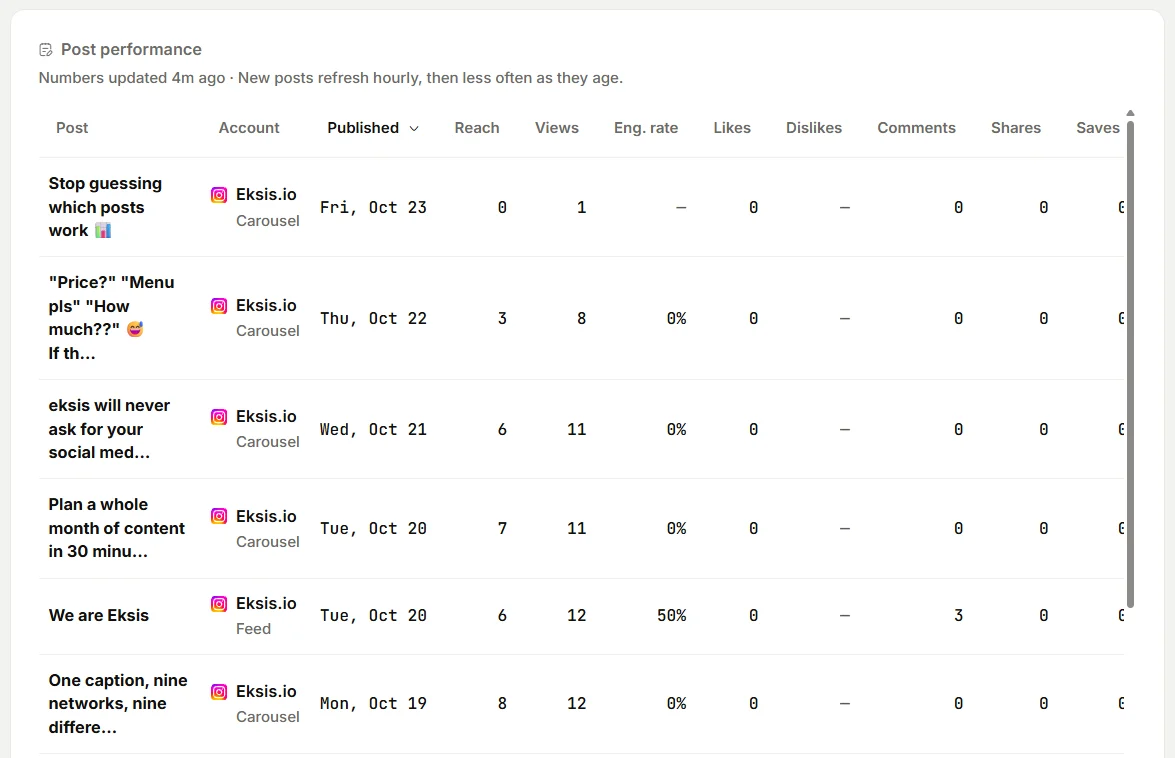
On plans with Analytics, open Analytics, or Insights under one account. The Post performance table lists every post in the period with its type under the account name (for example Reels, Carousel, Short, or Video) and columns for Reach, Eng. rate, likes, comments, shares, and saves. Sort by Reach to see which posts reached the most people, or by Eng. rate to see which drew the best response.
For a proper comparison, click Export, then Posts. The CSV has a Type column next to reach, engagement, and engagement rate for up to 200 recent posts in the period, so a pivot table can give you the median per format in one step.
A few limits to know:
- Facebook and Bluesky posts have no Eng. rate in eksis, because eksis receives no reach figure for them. Compare their interactions instead.
- YouTube videos you uploaded in YouTube Studio appear as Video even when they are Shorts. Only uploads scheduled in eksis as a Short carry that label.
- LinkedIn posts have no statistics in eksis, because LinkedIn shares post statistics only with apps approved for its Community Management API. eksis can publish photos to your LinkedIn profile as a PDF document, but you will need LinkedIn's own analytics to judge that format.
- eksis stops updating a post's numbers 30 days after it goes out.
To run the test, click Create post and choose the format on each channel's tab: feed, carousel, reels, or story on Instagram, post, photo, or reels on Facebook, Video or Short on YouTube, and Photo, Carousel, or Video on Pinterest. See compare plans for which plans include Analytics.
Related reading
- What counts as a good engagement rate on Instagram and Facebook
- How to post one vertical video to TikTok, Instagram Reels, and YouTube Shorts
- The social media metrics worth tracking, and the ones to ignore
Sources
- Buffer: The State of Social Media Engagement in 2026
- Buffer: Does X Premium really boost your reach? An analysis of 18M+ posts
- Socialinsider: 2026 Instagram organic benchmarks
- Socialinsider: 2026 social media benchmarks
- Rival IQ: 2025 Social Media Industry Benchmark Report
- Hootsuite: How to calculate engagement rate in 2026
- Sprout Social: Best times to post on social media in 2026
All were read on October 24, 2026. The companies update these studies, so check the source before you quote a number.
Frequently Asked Questions
Which Instagram format gets the most reach?
The studies disagree. Buffer's analysis of more than 4 million posts from 2022 to 2024 found Reels reach the most people. Socialinsider's 2026 benchmarks found carousels get the most views at every account size. They use different measures and periods, so test both on your own account.
Are carousels better than Reels on Instagram?
For engagement rate, Buffer, Socialinsider, Rival IQ, and Hootsuite all put carousels first, though Socialinsider's gap is small (0.55% against 0.52%). Reels may still reach more people who do not follow you.
What is the best post format on LinkedIn?
Buffer found document carousels earned a median engagement rate of 21.77%, about three times video and images. Hootsuite names video as LinkedIn's best-performing type. Test a document post against a video on your own profile.
Should I post links on social media?
Expect lower engagement. Link posts came last or near last on every network Buffer measured, and Buffer's X Premium analysis found link posts from regular X accounts had a median engagement rate of 0% from March 2025.
Can eksis tell me which format works best for my account?
eksis shows each post's type, reach, and engagement rate in the Post performance table, and Export, then Posts, gives you a CSV with a Type column to compare medians per format. It does not build the comparison chart for you, and it has no statistics for LinkedIn.